Several posters touched on ‘Supply and Demand’ as it relates to Librarians in the workforce. Having a buttload of hours of Economics under my belt, I want to talk about this in a little more detail. There is a lot to talk about; I will break it into several different blogs.
Supply and Demand
The Library Degree is easy and there are no barriers to entry. A few of you already see where this is going. And to make matters worse, there are plenty of people that can do the work, without a MLS. Those are the basic problems with the MLS. But more importantly, those are some of the reasons why supply of MLS’s is high, and Demand is static,,, or even dropping.

The law of Supply and Demand states that as demand for a good or service increases and supply remains the same, the Price Increases.
According to the
In the above graph you can see that S & D are in equilibrium where P1 and Q1 intersect. That is the quantity of librarians and the cost to obtain a librarian when in equilibrium. Congratulations, you are a commodity! This graph is actually accurate. I made it according to
Here is where it starts to get exciting,,, and a bit depressing. The Demand Curve (which has been a straight line so far) is not a nice clean 45 degree angle for librarians. The Demand Curve is actually closer to vertical. Why? Because there are only so many libraries. There are only so many positions for librarians. The physical limitations of ‘desks’ cap out your demand. The Demand Curve is actually closer to vertical. Many librarians are paid for with taxes. Most of the people that pay the taxes do not use the librarians. Demand can not exceed the number of ‘desks’ available and it is unlikely that enough demand will exist to build more libraries. Don’t get all nitpicky here and go into population growth and affluence, this overcomplicates the basic points I am trying to get across.
This graph more accurately represents the real scenario.
Here is the sad part,, while max demand is limited, minimum demand is not! Should supply ever falter, price will rise, and more people will enter library school, this shifting the Supply Curve back out to the right.
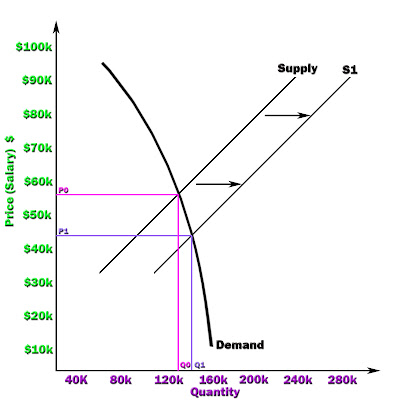
Here is a graph of what I am talking about:
Notice the minimal Quantity increase (Q0 to Q1) and the massive salary drop (P0 to P1) with a 20k increase in supply. Ouch. This is due is part to the capped demand.
Here is where it gets kinda scary. The Demand Curve can shift too. As Librarian jobs become more and more menial, more and more paraprofessionals are able to fill Librarian shoes. Also, more people are able to do their own reference work using online sources such as Google and Wikipedia. These factors reduce demand for librarians and shift the demand curve to the left.
This is the worst case scenario for Librarians. Not only are they loosing salary at an alarming rate (P2) but they are seeing fewer open positions (Q2)!
So, that is a basic rundown of Librarian Salaries and why they are what they are and where they are likely to go in the near future. Not a pretty picture unless something changes.
What can be done?
That will be the next blog. =)
References


1 comment:
I enjoyed this entry enormously. I'm not sure I follow all of the argument, but it does seem to capture my sense of the situation, after over 25 years in the library job market.
I look forward to the follow up.
Post a Comment